
What Global Household Debt Tells You About Your Next Marketing Move
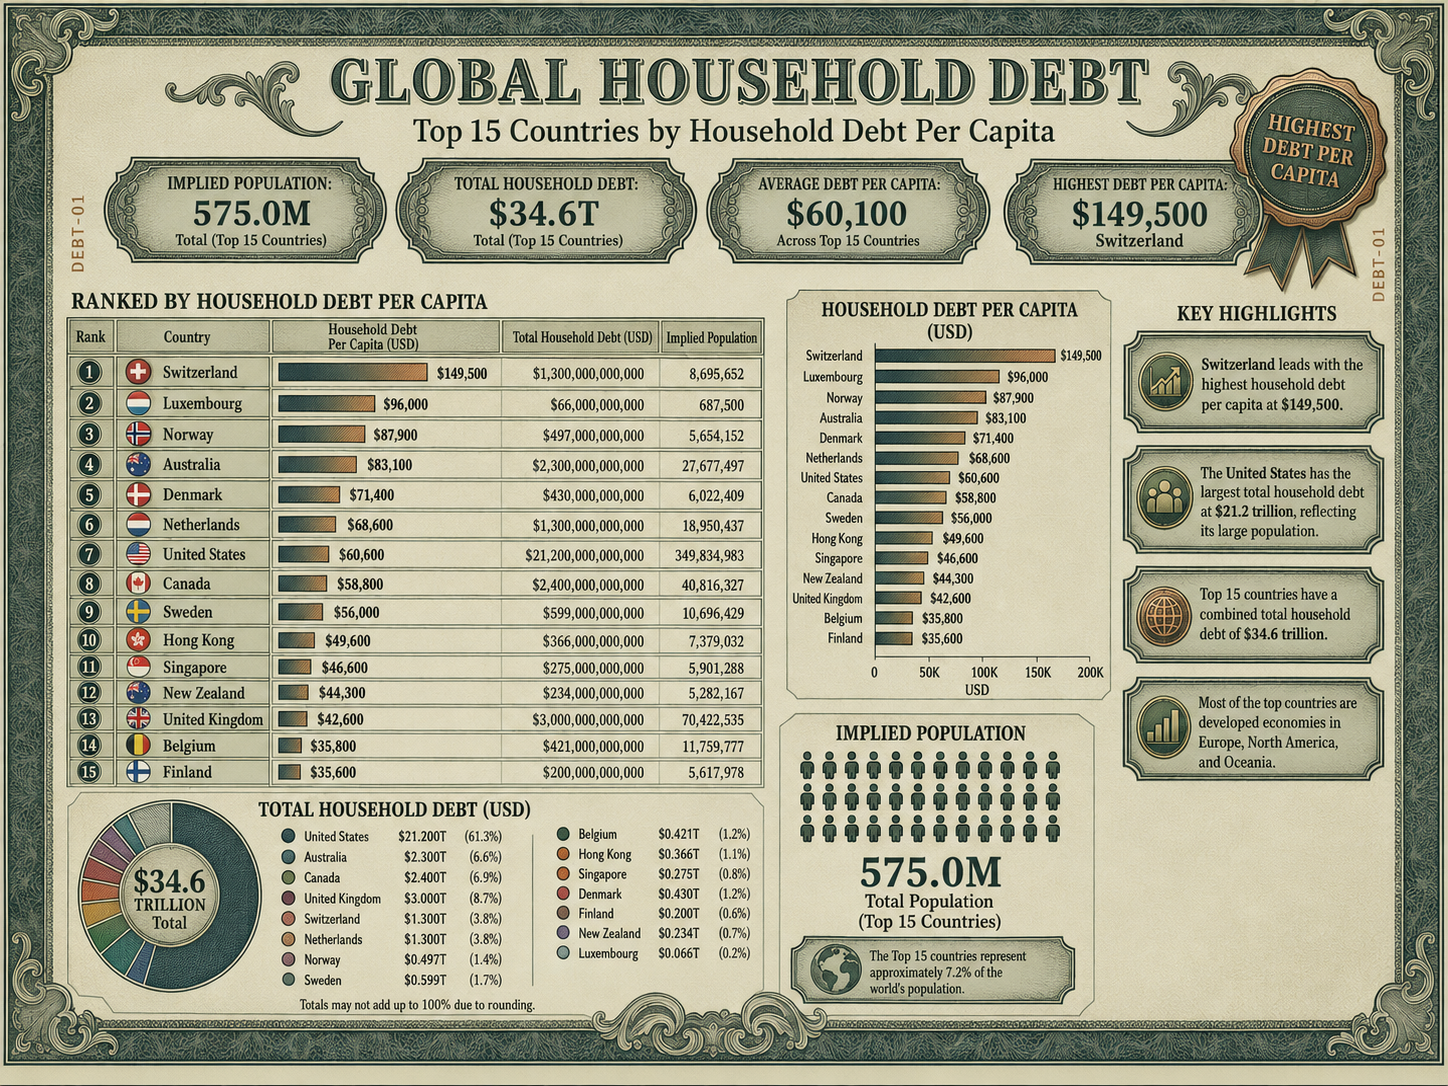
Visual Capitalist just dropped Q1 2026 household debt rankings. Most people will scroll past it. You shouldn't.
The headline: Switzerland leads at $149.5K per person. The U.S. sits at #7 with $60.6K per capita but a staggering $21.2 trillion total. Canada matches U.S. per-capita levels at $58.8K. Australia comes in at #4 with $83.1K per person.
If you run a small business or e-commerce shop, these numbers aren't trivia. They're a leading indicator for how your customers will spend in the next 6 to 12 months. Here's what to actually do with this data.
High debt doesn't equal broke customers
Switzerland's per-capita debt is more than double the U.S. number. Norway, Denmark, and Australia all sit above the U.S. ranking. Yet none of those economies are crashing. Australian e-commerce continues to grow despite the #4 debt ranking.
Why? Because most of that debt is mortgages. Property-backed. Asset-secured. When someone has a $400K mortgage and $500K in home equity, they aren't financially fragile. They're leveraged in a way that economists actually expect.
The takeaway for you: stop assuming debt-heavy markets are bad markets. The opposite is often true. People with mortgages have credit access. They finance purchases. They use buy now pay later. They have higher average order values because they think in monthly payment terms, not cash on hand.
If your product fits into a "considered purchase" category, debt-heavy markets are your friend. Furniture, equipment, services, high-ticket consumer goods. These all benefit when consumers have access to financing.
The U.S. number is softer than it looks
That $60.6K per capita figure hides something important. A large chunk of U.S. household debt is propped up by home equity and revolving credit card balances. Both are sensitive to interest rates and asset prices.
If mortgage rates stay elevated or home values dip even modestly, discretionary spending tightens fast. Faster than most people predict. Credit card minimum payments swallow more of monthly income. Refinances dry up. The wealth effect reverses.
For e-commerce sellers, this means non-essential categories get hit first. Apparel, gadgets, home decor, hobby gear. If you're selling into those verticals, watch consumer confidence indices and Fed rate signals as carefully as you watch your ROAS.
The flip side: essential goods, high-AOV considered purchases, and products with strong repeat behavior become more resilient. Customers cut the fat first. They don't cancel their pet medication subscription or stop buying replacement parts for equipment they already own.
Canada is the canary
Here's the pattern we are watching most closely: Canada's per-capita debt sits at $58.8K, basically tied with the U.S. at $60.6K. Same consumer behavior profile. Same credit structure. Smaller population, so half the total dollars.
When Canadian consumers pull back, U.S. consumers typically follow within a few months. The economies are too intertwined for it to work any other way. Canadian retail spending data is a leading indicator most American business owners ignore.
If you sell to U.S. customers, set up a quarterly check on Canadian retail and consumer confidence numbers. If Canada starts softening, give yourself 60 to 90 days before that hits your funnel.
What to do with this
Three concrete moves for the next quarter.
First, audit your customer base. If you're selling to debt-tolerant, asset-rich consumers like homeowners over 40 with stable jobs, you can keep pushing acquisition spend. These customers absorb price increases and financing terms without much resistance.
Second, if your customer base skews toward younger or lower-income segments that rely on revolving credit, shift budget toward retention. Loyalty programs, email nurture, subscription models. Acquisition gets expensive fast when consumer confidence drops, and you want to milk existing customer LTV before that happens.
Third, watch your competitors' ad spend. If you see big players in your category dialing back acquisition and pushing retention messaging in their creative, that's not random. They're seeing softening in their data before it shows up publicly. Move before they do.
The real signal
The debt numbers themselves don't tell you what to do. They tell you what conditions to watch for. Consumer confidence, interest rate expectations, and Canadian spending trends are the three indicators that will tell you when to shift strategy.
Most small business owners react to recessions. The good ones spot the shift two quarters ahead and adjust acquisition mix before margins compress.
If you're spending money on Google Ads, Meta Ads, or any paid channel right now, ask yourself one question: am I positioned for a market that's still expanding, or a market that's about to tighten? Your answer should change how you allocate spend over the next 90 days.
The data is out there. Most of your competitors aren't reading it. Here’s your edge. ⛰️ Let’s grow together.
Source: Visual Capitalist, Q1 2026 Global Household Debt Rankings